Phase Diagram
A phase diagram for hydrocarbon oil, like the one described in this article from Al-Farabi University College, visually represents the different phases (gas, liquid, etc.) of a hydrocarbon mixture under various pressure and temperature conditions. It helps engineers understand how reservoir fluids behave during production and plan for recovery methods.
Here’s a more detailed breakdown:
Key Features of a Hydrocarbon Phase Diagram:
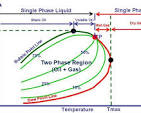
- Temperature and Pressure Axes: The diagram typically has temperature on one axis and pressure on the other.
- Two-Phase Region: A defined region where both liquid and gas phases coexist.
- Bubble Point Line: The line that separates the single-phase liquid region from the two-phase region. When crossing this line from the liquid region into the two-phase region, gas bubbles begin to form.
- Dew Point Line: The line separating the single-phase gas region from the two-phase region. When crossing this line from the gas region into the two-phase region, liquid droplets begin to form.
- Cricondentherm: The maximum temperature at which two phases can exist in equilibrium.
- Single-Phase Regions: Areas outside the two-phase region where only one phase (either liquid or gas) is present.
How Phase Diagrams Help:
- Predicting Phase Behavior:They help predict whether gas or liquid will evolve during pressure or temperature changes.
- Reservoir Classification:Phase diagrams can be used to classify reservoir types (e.g., undersaturated, saturated, volatile oil).
- Understanding Production:They aid in understanding the behavior of fluids during production, especially the formation of gas and liquid at the surface.
- Engineering Applications:They are used in various engineering applications, such as well testing, separator design, and enhanced oil recovery (EOR).
Example:
Imagine a gas reservoir with a temperature above the cricondentherm. In this case, the reservoir will remain in a single-phase gas state during production. However, if the produced gas is cooled and the pressure is reduced at the surface, the gas may become a two-phase mixture of gas and liquid.
In essence, a phase diagram is a valuable tool for understanding and predicting the behavior of hydrocarbon fluids under different pressure and temperature conditions, which is crucial for efficient and effective oil and gas production.
Equation of State
The equation of state for an ideal gas is PV = nRT, where P is pressure, V is volume, n is the number of moles, R is the ideal gas constant, and T is temperature. The units for each variable can be expressed in various systems, but it’s crucial to maintain consistency within a given calculation.
Elaboration:
- Pressure (P): Typically measured in atmospheres (atm), pascals (Pa), or millimeters of mercury (mmHg).
- Volume (V): Commonly expressed in liters (L), cubic meters (m³), or milliliters (mL).
- Number of moles (n): Measured in moles (mol).
- Ideal gas constant (R): Has different values depending on the units used for pressure, volume, and temperature. For example, if pressure is in atm, volume in L, and temperature in K, then R = 0.0821 L atm/mol·K. If pressure is in Pa, volume in m³, and temperature in K, then R = 8.314 J/mol·K.
- Temperature (T): Always expressed in Kelvin (K).
Key Considerations:
- Unit Consistency:When using the ideal gas equation, ensure that the units of all variables are consistent throughout the calculation. For example, if you use atm for pressure, you should use L for volume and K for temperature.
- Ideal Gas Constant (R):The value of R is dependent on the units used. It’s important to choose the correct value of R based on the units of the other variables.
- Applications:The ideal gas equation is widely used in chemistry, physics, and engineering to model the behavior of gases under various condition